Creating whimsical, personal data visualizations remains a challenge due to a lack of tools that enable for creative visual expression while providing support to bind graphical content to data. Many data analysis and visualization creation tools target the quick generation of visual representations, but lack the functionality necessary for graphics design. Toolkits and charting libraries offer more expressive power, but require expert programming skills to achieve custom designs. In contrast, sketching affords fluid experimentation with visual shapes and layouts in a freeform manner, but requires one to manually draw every single data point. We aim to bridge the gap between these extremes. We propose DataInk, a system supports the creation of expressive data visualizations with rigorous direct manipulation via direct pen and touch input. Leveraging our commonly held skills, coupled with a novel graphical user interface, DataInk enables direct, fluid, and flexible authoring of creative data visualizations.
Haijun Xia, Nathalie Henry Riche, Fanny Chevalier, Bruno de Araujo, Daniel Wigdor. DataInk: Direct and Creative Data-Oriented Drawing.
In Proceedings of ACM SIGCHI 2018, to appear. Honourable Mention Award
DataInk is composed of five UI components. The visualization canvas (a) shows the generated
visual representation of the data, as well as any visual elements
not bound to data such as handwritten text or illustrative marks.
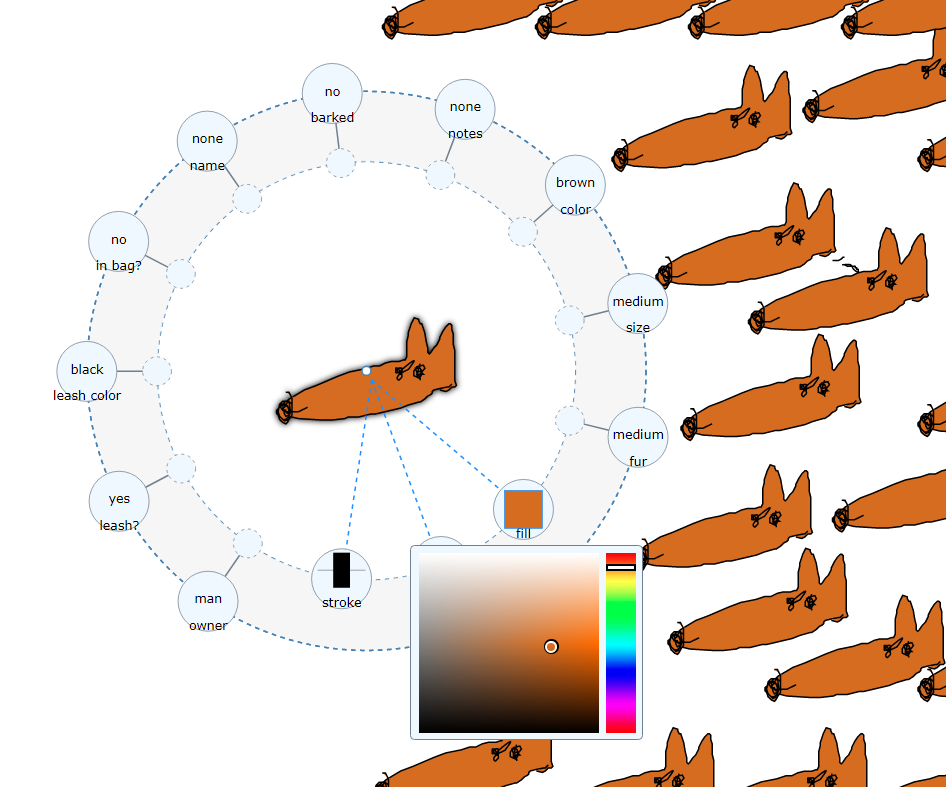
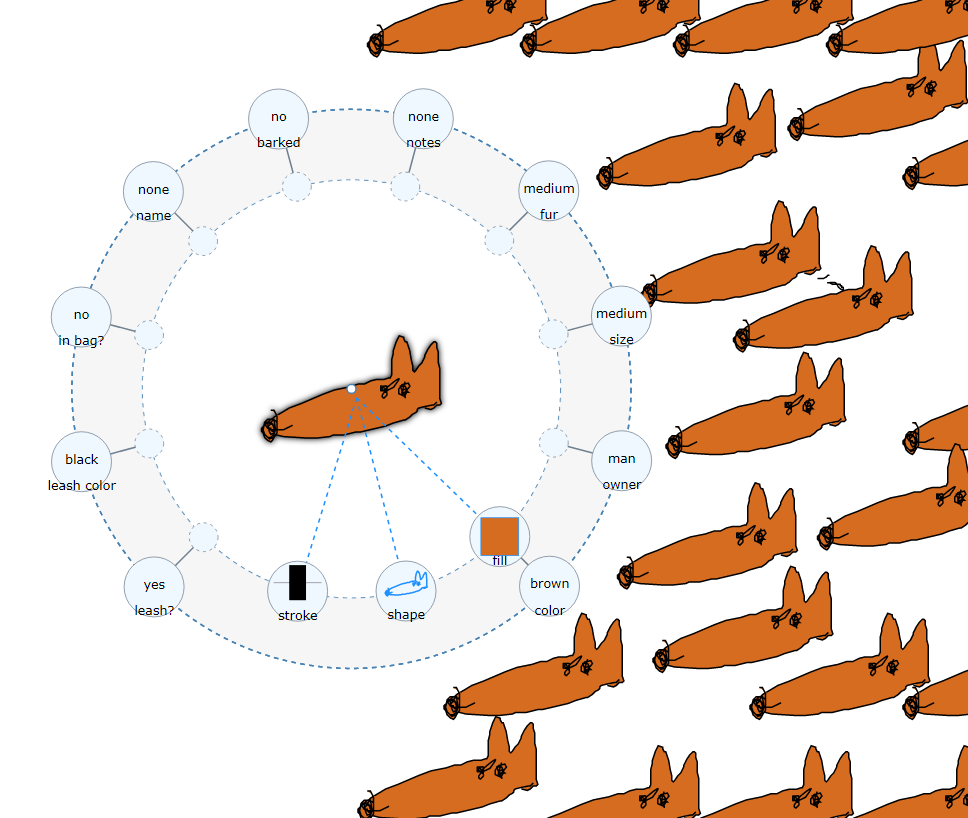
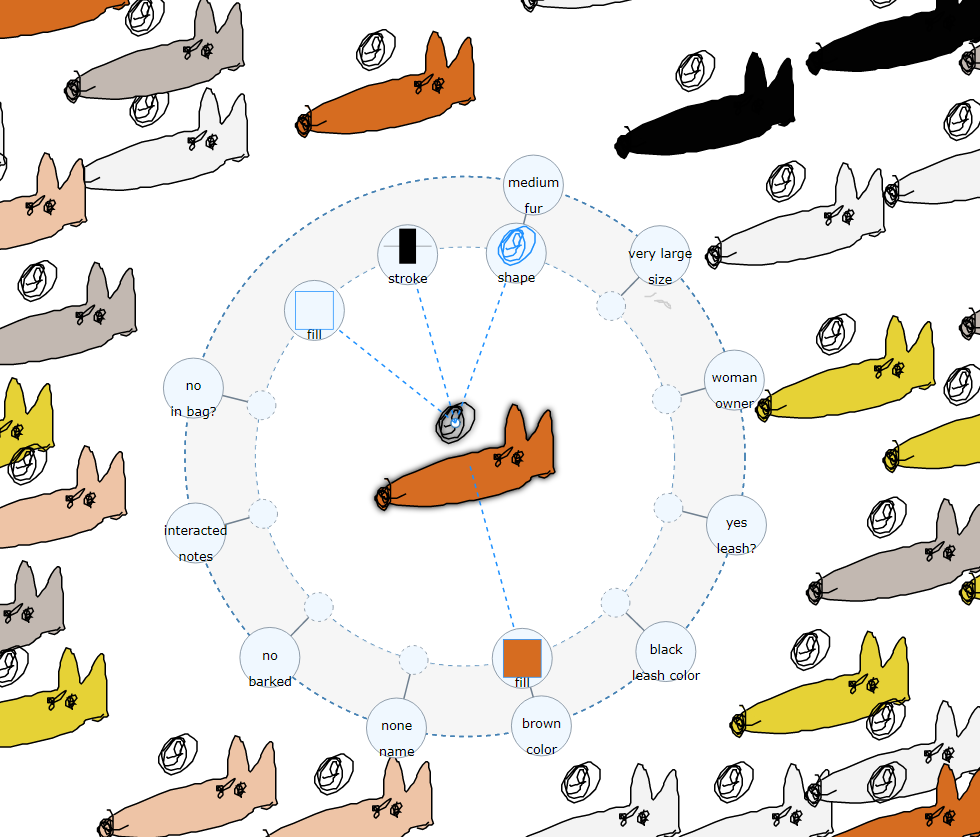
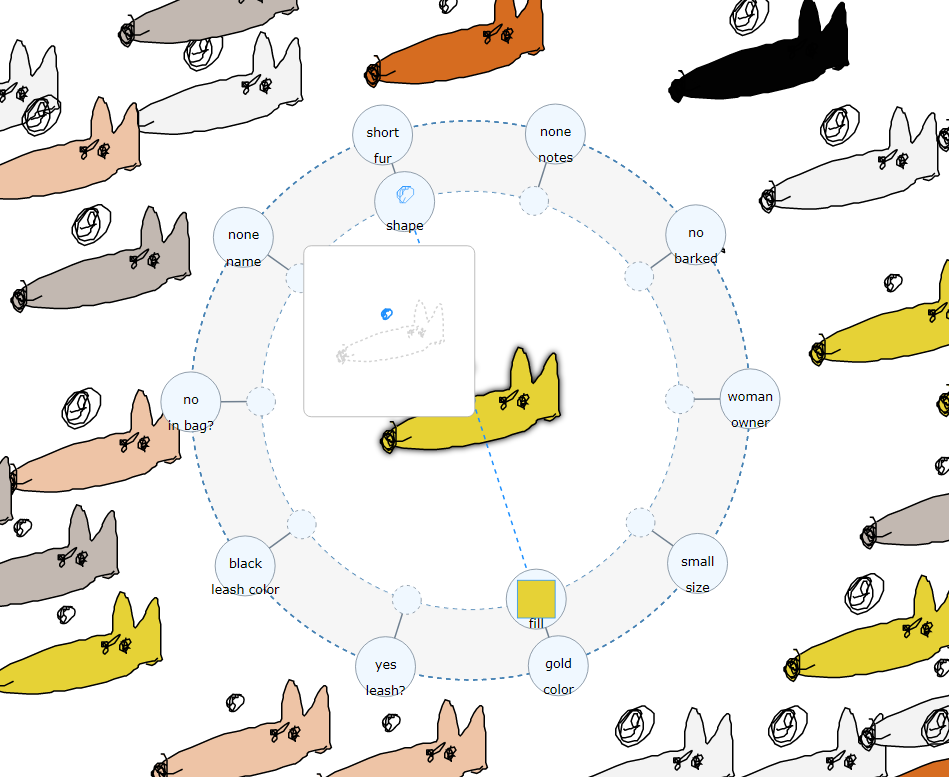
A contextual visual-data palette (b) appears when the authors taps on a visual element, enabling them to set appropriate mappings.
The legend depicting the sets of mapping between visual encodings and data dimensions are grouped in two panels:
one for the glyph (c) and one for the layout (d). A side menu (e) allows an
author access to functionality such as searching vector graphics, loading data, saving the visuals,
as well as providing access to several illustration tools.
DataInk provides the following vocabulary of pen and touch interactions:
Below is an example workflow, see video for more details.
1) Draw a dog shape, change its fill color, bind it to its data value:
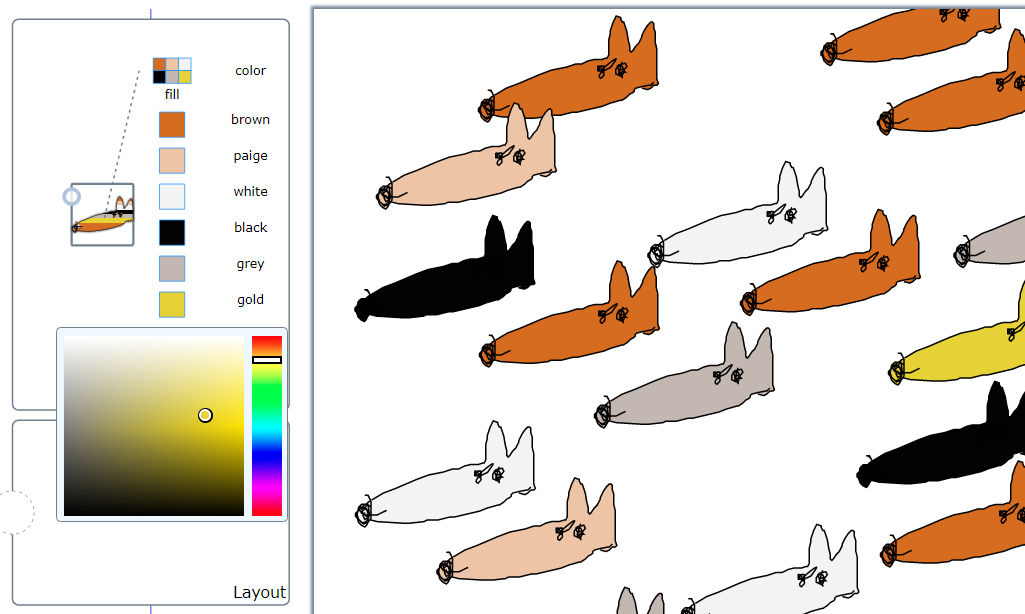
2) Adjust the color for all data values from the legend:
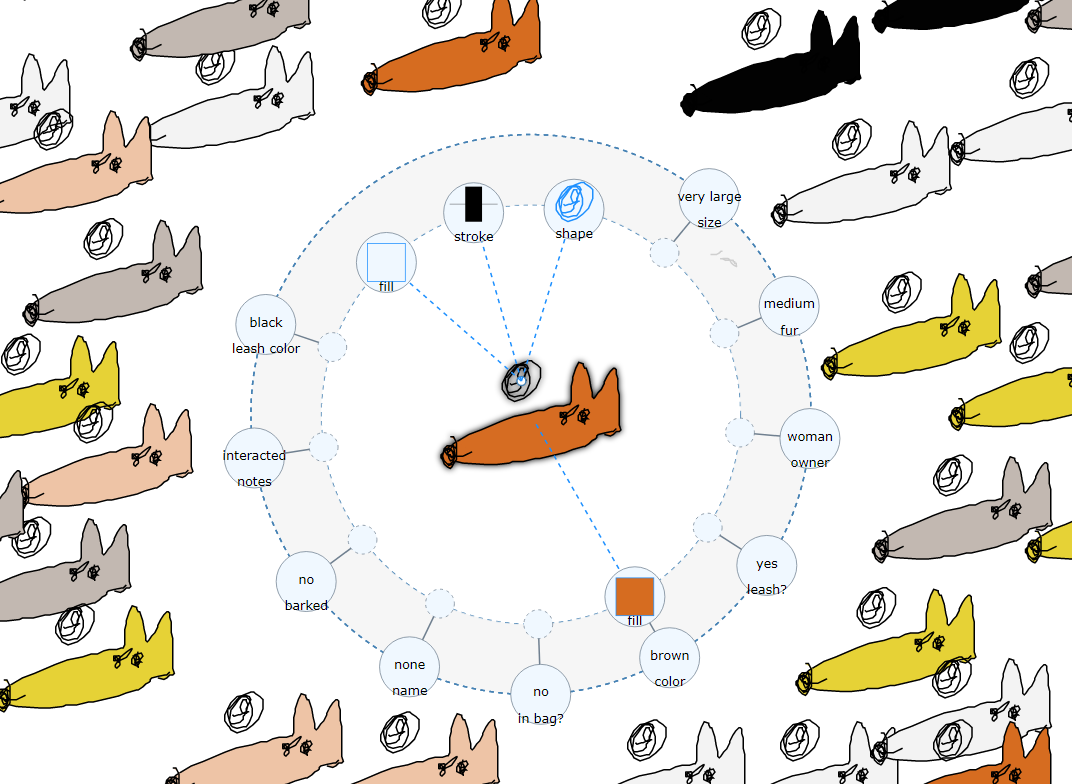
3) Add a hair ball on top of the dog's head, bind it to fur length, edit the shape for different data values
Examples
Mouse over images to play the videos.
Note that examples were generated on a surface pro 3 and are shown in accelerated speed.
Study Results
We conducted a user study to gain insights into the potential of DOD in supporting design expression, rigorous execution
and creative expression, as well as the usability of DataInk for authoring data visualizations.
We targeted designers to understand tradeoffs of DOD compare to graphics design tools,
and invited non-experts (limited experience in programming, data analysis and design) to
assess the receptiveness of DOD by a general audience.
We ask participants to:
1) Replicate an example starting from scratch,
2) Iterate on their design to achieve a second example,
3) Freeform exploration to create their own data visualization.
All managed to complete tasks 1 and 2 successfully. Below are the results of their freform exploration.